
2023 VAT Gap report shows that progress was made in VAT compliance in 2021
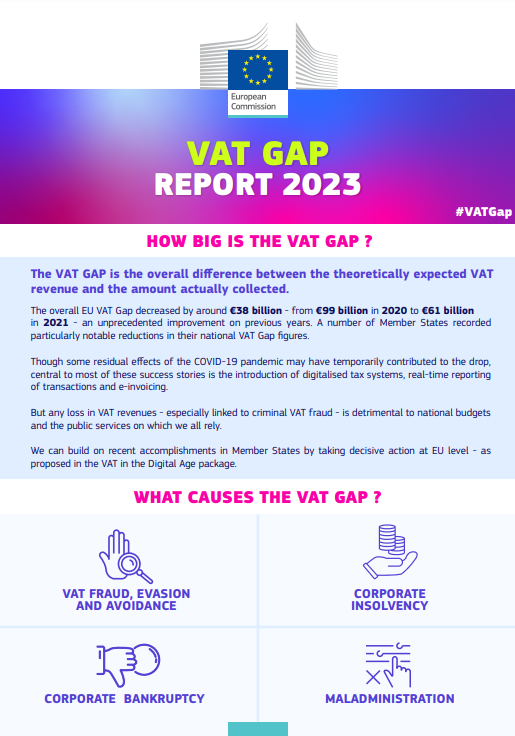
Most EU Member States made progress in the enforcement of Value-Added Tax (VAT) compliance in 2021, according to the 2023 VAT Gap report released by the European Commission. The annual study shows that Member States lost around €61 billion in VAT in 2021, compared to €99 billion in 2020.
This figure represents revenues lost mainly to VAT fraud, evasion and avoidance, non-fraudulent bankruptcies, miscalculations and financial insolvencies, among other drivers.
The 2023 report shows that while some revenue losses are impossible to avoid, targeted policy responses seem to have made a difference, particularly those related to digitalisation of tax systems, real-time reporting of transactions and e-invoicing. At the same time, temporary factors such as government support measures implemented during the COVID-19 pandemic, which were often contingent on paying taxes, may also have played a role in driving this positive change.
2023 report: Main findings
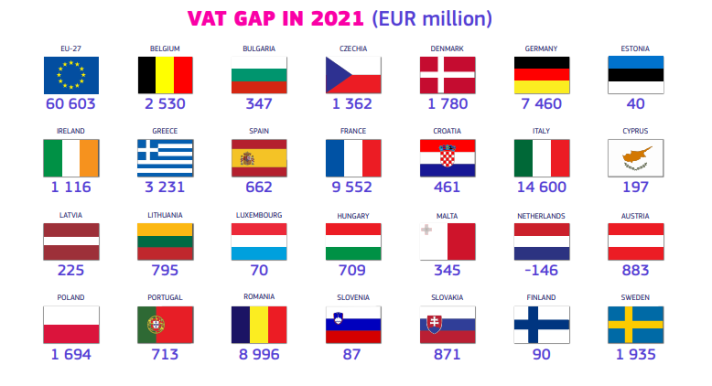
In nominal terms, the overall EU VAT Gap decreased by around €38 billion, from €99 billion in 2020 to €61 billion in 2021, an unprecedented improvement on previous years. A number of Member States such as Italy (-10.7 percentage points) and Poland (-7.8 percentage points) recorded particularly notable reductions in their national VAT Gap figures.
The smallest gaps were observed in the Netherlands (-0.2%), Finland (0.4%), Spain (0.8%), and Estonia (1.4%). As was the case in the Netherlands, negative values can occur in Member States where non-compliance is already very low due to statistical and measurement inconsistencies.
| Country | Vat Gap in 2021 (EUR million) |
|---|---|
| Austria | 883 |
| Belgium | 2 530 |
| Bulgaria | 347 |
| Czechia | 1 362 |
| Croatia | 461 |
| Cyprus | 197 |
| Denmark | 1 780 |
| Estonia | 40 |
| Finland | 90 |
| France | 9 552 |
| Germany | 7 460 |
| Greece | 3 231 |
| Hungary | 709 |
| Ireland | 1 116 |
| Italy | 14 600 |
| Latvia | 225 |
| Lithuania | 795 |
| Luxembourg | 70 |
| Malta | 345 |
| Netherlands | -146 |
| Poland | 1 694 |
| Portugal | 713 |
| Romania | 8 996 |
| Slovakia | 871 |
| Slovenia | 87 |
| Spain | 662 |
| Sweden | 1 935 |
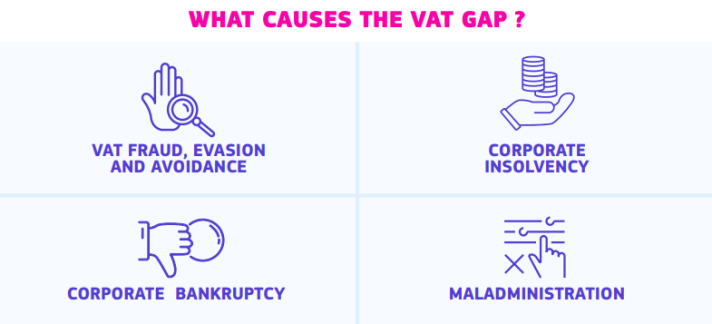
What causes the VAT Gap?
The VAT Gap provides an estimate of the VAT revenue loss due to VAT fraud, evasion and avoidance, non-fraudulent bankruptcies, miscalculations and financial insolvencies, among other drivers. Other circumstances that could have an impact on the size of the VAT Gap include economic developments, one-off government support measures and the quality of national statistics.
Why is monitoring of the VAT Gap important?
Variations in VAT Gap estimations between EU countries reflect the existing differences in Member States in terms of tax compliance, fraud, avoidance, bankruptcies, insolvencies and tax administration
It is important to monitor the VAT Gap since:
- It is a proxy of the performance of national tax administrations in their VAT collection.
- Lost VAT revenues have an extremely negative impact on government spending in public goods and services such as schools, hospitals and transport. The missing VAT could also prove beneficial as Member States strive to reduce debt-to-GDP ratios in the wake of the COVID-19 pandemic, or raise their climate financing ambitions.
- VAT does not only contribute to national budgets but is also a source of revenue for the EU budget. It is therefore imperative that work at the EU-level complements Member States’ actions in the area of VAT. For this reason, the European Commission has put forward new measures on VAT in the digital age to improve VAT collection and to reduce the VAT Gap.
- Estimates of the scale of the VAT Gap can help to develop well-targeted measures and monitor their effectiveness.
VAT GAP Country Specific Reports
- Austria
- Belgium
- Bulgaria
- Croatia
- Cyprus
- Czech republic
- Denmark
- Estonia
- Finland
- France
- Germany
- Greece
- Hungary
- Ireland
- Latvia
- Lithuania
- Luxembourg
- Netherlands
- Poland
- Portugal
- Romania
- Slovakia
- Slovenia
- Sweden
Previous VAT gap reports
- Report 2022: Report - Executive Summary - Tables Report - Graphs Report - Tables Country Chapter
- Report 2021: VAT gap in the EU - Report 2021
- Report 2020: Study and reports on the VAT gap in the EU-28 Member States
- Report 2019: Study and reports on the VAT gap in the EU-28 Member States
- Report 2018: Study and reports on the VAT gap in the EU-28 Member States
- Report 2017: Study and reports on the VAT gap in the EU-28 Member States
- Report 2016: Study and reports on the VAT gap in the EU-28 Member States
- Report 2015: Study to quantify and analyse the VAT gap in the EU Member States
- Report 2014: 2012 update report to the study to quantify and analyse the VAT gap in the EU-27 Member States
- Report 2013: Study to quantify and analyse the VAT gap in the EU-27 Member States
- Report 2009: Study to quantify and analyse the VAT gap in the EU-25 Member States